Introduction to Color Science
October 28, 2024Transcript
When we talk about image quality, most people focus on resolution—the number of pixels in an image, which is important for sure. But what about the qualities of each one of those pixels, such as bit depth, dynamic range, and color space?
These are some of the key elements when it comes to color science. Understanding color science and management can fundamentally change how you capture, generate, or process images. That’s what we are going to be talking about in this video.
Let’s take a look at each one of these one by one: bit depth, dynamic range, and color spaces.
Bit Depth
Bit depth refers to the number of bits used to define each color component of pixels. The more bits per pixel, the more colors you can represent.
Let's take an 8-bit RGB image as an example. It uses 8 bits for each of the red, green, and blue channels. This means we can have 256 values per channel. When we combine these channels, we get about 16.8 million possible colors per pixel.

Sounds like a lot of colors, but it actually provides very little room for editing. When you try to color grade, adjust colors, contrast, or exposure of your footage, you can easily get banding artifacts.
That's why images used in professional workflows typically involve at least 10 bits.
The bit depth determines how many colors can be represented but it doesn’t tell what colors and in what range of brightness can be represented.
Dynamic Range
The range of brightness is determined by the dynamic range, which determines how dark and how bright a pixel can get.
A high dynamic range is great, even if you're not using an HDR display. Because it lets you adjust the exposure after the fact without losing detail in the shadows or highlights.
When the lightness of a pixel is out of boundaries of the dynamic range, it gets clipped and loses detail as a result.

For example, I have a standard dynamic range image on the left and a high dynamic range (HDR) image on the right. At first glance, they might look the same, because this video itself is not high dynamic range. But if we lower the exposure in post, we'd see a big difference. The HDR image still retains the highlights. It had more dynamic range than a display can show. It had more room for editing. This was not the case for the SDR image. Look at all those highlights that were lost.
Log Profile
HDR images use more bits to represent the higher dynamic range, but even with the same number of bits the dynamic range can be different.
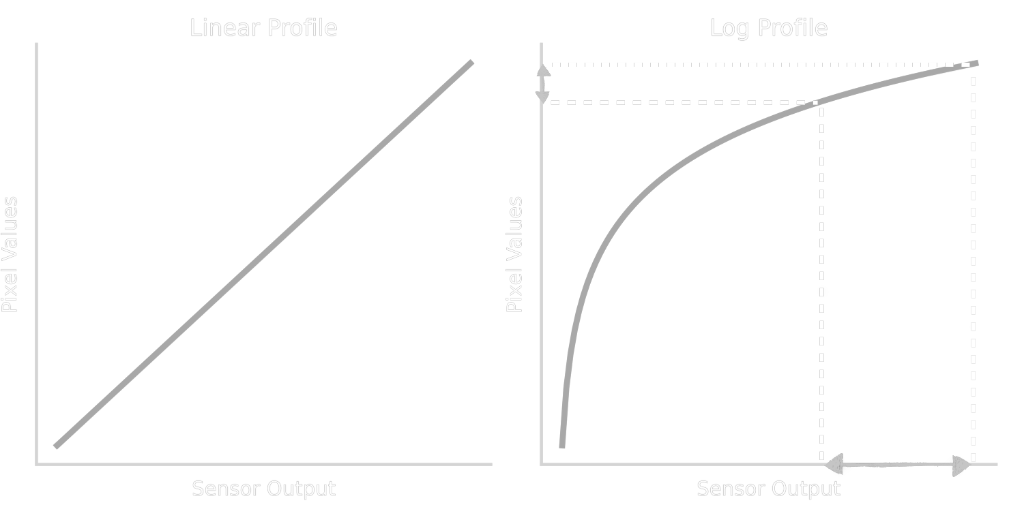
A logarithmic curve, for example, is often used to compress a wide range of luminance values into a smaller bit-depth range. This allows for more efficient storage while preserving detail in both the shadows and highlights. Which gives us flexibility in color grading and correction. This is also known as log profile on digital video cameras.

Videos shot in log profile look washed out before any color grading is applied. This is because displays don't naturally interpret log profiles correctly. Why? We’ll get back to that later.
To put this into context, let’s first talk about color spaces.
Color Spaces
The dynamic range determines the range of brightness. The range of colors is determined by the color gamut. Color gamut refers to the range of colors which a device can capture or display. And color spaces define how those colors are represented.
In 1931, the International Commission on Illumination introduced a three-dimensional space representing all perceivable colors, known as the CIE XYZ color space. This color space provides a standard reference against which color spaces can be defined, measured, and converted to each other.

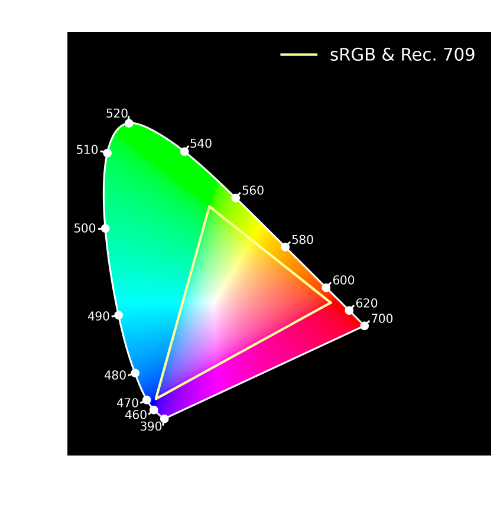
This CIE 1931 chromaticity diagram is a two-dimensional projection of that. It visualizes only the chromaticity, independent of luminance. It shows all colors visible to the human visual system in this horseshoe shape known as the spectral locus. Along this curved edge, you see the wavelengths of light. The straight line in the bottom, known as the line of purples, on the other hand has no wavelength. Because purple is not a “real” color! Purple is not a real color in the sense that it doesn't have a single wavelength of light. It’s the way our brain perceives a mixture of red and blue to make sense of what's being seen.
Obviously, the colors on this chart are not the actual colors but are just an approximation. Because our displays can't show the full range of colors our eyes can see. A monitor using the standard RGB (sRGB) color space, for example, can show the colors within this triangle on the chart.
RGB Color Spaces
An RGB colorspace is defined by 3 components: primaries, whitepoint, and transfer functions.
- The primaries are the corners of the triangle in this diagram. They set the boundaries for the colors that can be represented using a specific color space.
- The whitepoint is a reference point that defines what is considered "white" within that color space. Typically, it’s based on a standard illuminant, such as D65, which approximates average daylight. The whitepoint provides a common baseline for color balance.
- Finally, transfer functions define the relationship between the actual light intensity and its digital representation.
Here’s what I mean by that.
Camera sensors perceive light linearly. Twice the amount of light results in twice the sensor response. To a camera sensor, the difference between no light and one light bulb is perceived as more or less the same as the difference between 49 and 50 light bulbs.
That's obviously not the case for human vision. Switching the first bulb clearly makes a bigger difference. Going from no light to some light is a lot more noticeable than switching the 50th light on, which barely makes any difference.
The just noticeable difference in brightness follows a logarithmic scale, meaning that our perception of changes is based on relative rather than absolute differences. This phenomenon is described by Weber's Law and applies to many other senses.
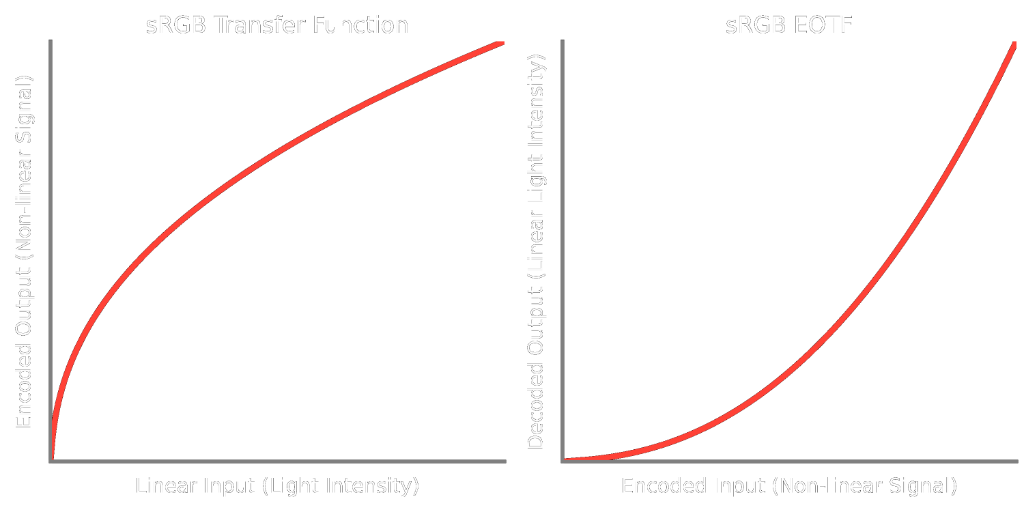
A transfer function takes that into account. It takes linear sensor data and compresses it in a way that more bits are used to represent lower light levels, where humans are more sensitive to differences, and fewer bits are used for higher light levels, where the eye is less sensitive. This type of transfer function is called an Opto-Electronic Transfer Function (OETF).
Displays do the opposite of that. They take in that compressed signal and map that back to linear light output. This is called the Electro-Optical Transfer Function (EOTF), because we go from electrical input signals to optical output light.
Transfer functions are typically expressed by a power function with a gamma value of around 2, commonly 2.2 or 2.4. Gamma curves are similar to, but not the same as, log curves. Log curves encode a higher dynamic range.

You might wonder why gamma encoding was adopted instead of simply using monitors that invert a log profile. It’s because of historical reasons!
CRT displays naturally follow a nonlinear power-law curve, which made gamma a more practical choice for display technology at the time.
Unlike gamma encoding, logarithmic encoding wasn’t designed to be tied to a display technology. Instead, it was designed to represent a high dynamic range efficiently.
Commonly Used Color Spaces
Before we move on I think it's worth mentioning some color spaces that are commonly used.
- sRGB and Rec. 709 both share the same color primaries, with different transfer functions. sRGB is commonly used for still images, Rec. 709 is used for videos.
- Another common color space is Rec. 2020, which has a wider color gamut and is used for HDR content.
The color spaces we talked about so far are considered RGB color spaces because they define specific sets of RGB primaries. There are other color spaces as well.
For example, CIELAB (see-lab) represents color as three values: one for lightness, one for green and red, and one for blue and yellow. Those color pairs are opponent colors.

Have you ever tried to imagine a greenish red, or bluish yellow? I don’t mean colors you get when you mix them. I mean a single color that looks red and green or blue and yellow at the same time. Quite hard, isn't it? That's because our visual system perceives those colors as directly opposite to each other.
CIELAB uses those color dimensions to represent color rather than a mixture of RGB to have a more perceptually uniform space. Meaning that a change in the values would correspond to a similar perceived change in color.
There are also other color spaces that separate brightness and color for different purposes, such as video encoding.
YCbCr, for example, consists of a luma component Y and chroma components Cb and Cr.
Chroma Subsampling
Since human vision is more sensitive to luminance than color, chroma channels can be subsampled and given less bandwidth than the luma component without much loss in perceived quality. This process is called chroma subsampling.

That's what the ratios you see in digital media formats like ProRes 422 mean. A 4:2:2 ratio indicates horizontal chroma subsampling: half the resolution in the horizontal axis. 4:2:0 means half the resolution in both axes, and 4:4:4 means no chroma subsampling.
Anyway, I digress, this falls more in the domain of video processing and compression than color science but it’s good to know.
Scene Referred Data
Cameras typically capture more data than displays can reproduce. This is especially true for high-end cameras used in production. Their color gamuts are wider than any display can show. So, the colors they capture are adjusted, compressed, or clipped to fit within what a target display allows. This brings us to the concepts of scene-referred and display-referred data.
Scene referred data represents the real world, rather than the light leaving the screen. It is not meant to be viewed directly. Instead, it aims to represent the physical properties of the scene, such as the intensity and color of the light in the real world.
Display-referred data, on the other hand, represents what will be shown on a display.
Color Management
So, how do we go from scene-referred data to display-referred data? That’s where color management comes into play.
Color management involves a series of steps, including color space transformations, tone mapping, gamut mapping, and Look-Up Tables (LUTs), which map input colors to output colors.
The goal of this whole process is to ensure that the final image is visually pleasing, true to the creative intent, and respects the constraints of the target display.
ACES
There is an industry-standard framework that facilitates this process. It is called the Academy Color Encoding System, or ACES for short.
Having standard formats makes it easier to work with different brand cameras and even virtual cameras and CGI elements. It allows them all to exist in the same space.
ACES has a scene-referred color space, called ACES2065-1. It has a linear representation, meaning that it represents light just like the camera sensors capture it. If you double the amount of light, the values also double. So, multiplying all the values by two increases the exposure by one stop. It has no log curves, but it still captures a wide dynamic range because it has a high bit depth, typically 16 or 32 bits.
ACES2065-1 uses primaries that contain every visible color! They are called AP0 primaries. On this diagram, AP0 primaries form the smallest triangle that contains the entire spectral locus. It even covers some colors that we can’t see.
Camera manufacturers have their own secret sauce to whatever color science they use to capture and process images. ACES expects them to provide Input Device Transforms (IDTs) to convert their camera's raw data into this standardized, scene-referred, linear color space. Regardless of the input source—be it different cameras, CG renders, or anything else—IDTs transform it into ACES.
Once in this color space, you can do all your work, including color grading, compositing, VFX, and CGI. Finally, you use an Output Device Transform (ODT) to convert your work into the target format, such as Rec. 709 or Rec. 2020.
Lastly, it’s worth mentioning some derivative working spaces. ACEScc, ACEScct, and ACEScg, for example, use AP1 primaries, which have a smaller gamut than AP0, but avoid most non-visible colors.
Unlike ACES2065-1, ACEScc and ACEScct are logarithmic color spaces, which many professionals in color grading are familiar with. ACEScc provides a pure log encoding, whereas ACEScct has a "toe" in the shadows, which emulates the behavior of film.
ACEScg, on the other hand, is a linear color space similar to ACES2065-1 but uses AP1 primaries. It is mainly designed for CGI and compositing work.
Alright, that was pretty much it! I hope you found it interesting and useful. Thanks for watching, and see you next time.


